Working with GPS-data
GPS-receivers are available for some years now but only recently the technology has become mature in order to apply it to small animals like pigeons: small with a light-weight battery and enough performance to store data for several hours.
Information on pigeon tracking has already been investigated and published, mainly for racing pigeons; exact data on the flying behaviour of highflyers and tipplers are rare. Some attempts have been recorded but I did not find any data recorded with recent gps-technologies.
Early 2010 I purchased some gps-devices for pigeons; I found two providers on the internet and by April the devices were operational. Those providers have left the market, but recently GPS tracking is available as a pigeon ring; see Skyleader.
How does it work ?
The device consists of a battery, a GPS-antenna, and memory to store the data. Before the flight the device is attached on the back of the pigeon and activated. During the flight, height and positioning are recorded with a predefined interval, configurable between 1 second to 3 minutes. After the flight the device is removed and the data are downloaded to a pc with the accompanying software program and a special USB-to-serial cable.
Depending on the supplier the data are presented in different formats.
Pigeontrack (not on the market anymore) supplies the data as a KML-file which is directly available after download. This KML-file can be uploaded in Google Earth and contains all the information that Google Earth needs to visualize the path and the tracking points. Each points displays the following information:
- Height, latitude and longitude
- Velocity (in feet)
- Time stamp
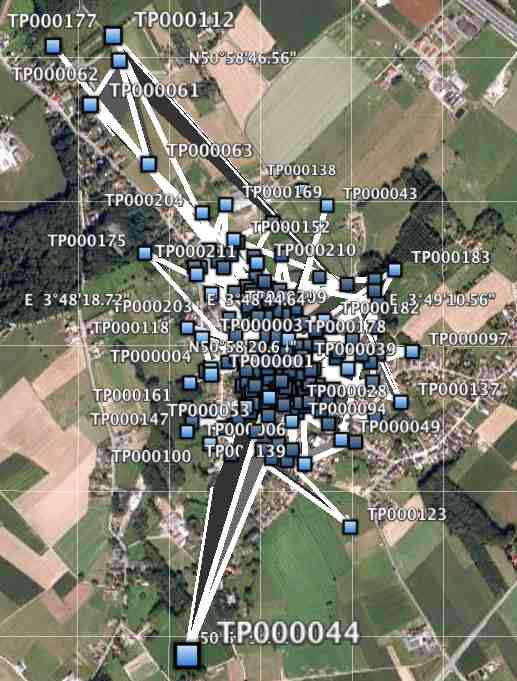
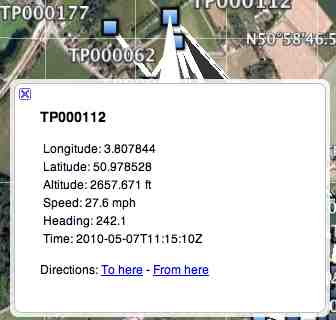
A PigeonTrack KML-file is illustrated in photo 1. In this example, there is a half minute time interval between each point. The points are connected by a line which represents the path. With an interval of half a minute, the track does however not reflect the exact path the pigeons have traveled: tipplers fly in circles and points are connected by a straight line. Each point is identified by a number. By clicking on a point, Google Earth displays a property sheet with the characteristics of each point, as illustrated in photo 2.
|
photo 1: Google Earth screenshot of a PigeonTrack KML file |
|
TechnoSmArt (Italian company) delivered the data in different formats.
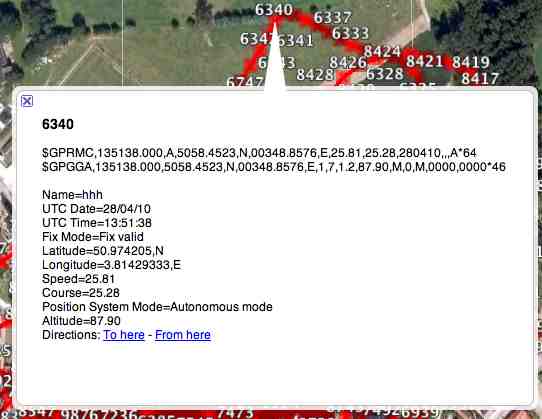
First of all the data are downloaded as a flat text file with primitive GPS-data, saved according to the NMEA-format; these data are quite cumbersome to analyse and knowledge on GPS data storage is a prerequisite.
These basic data can then be converted by the TechnoSmArt software to a KML-format for Google Earth.
Finally, the TechnoSmArt software can convert the data to a text-file, which can be easily imported in a spreadsheet for further analysis.
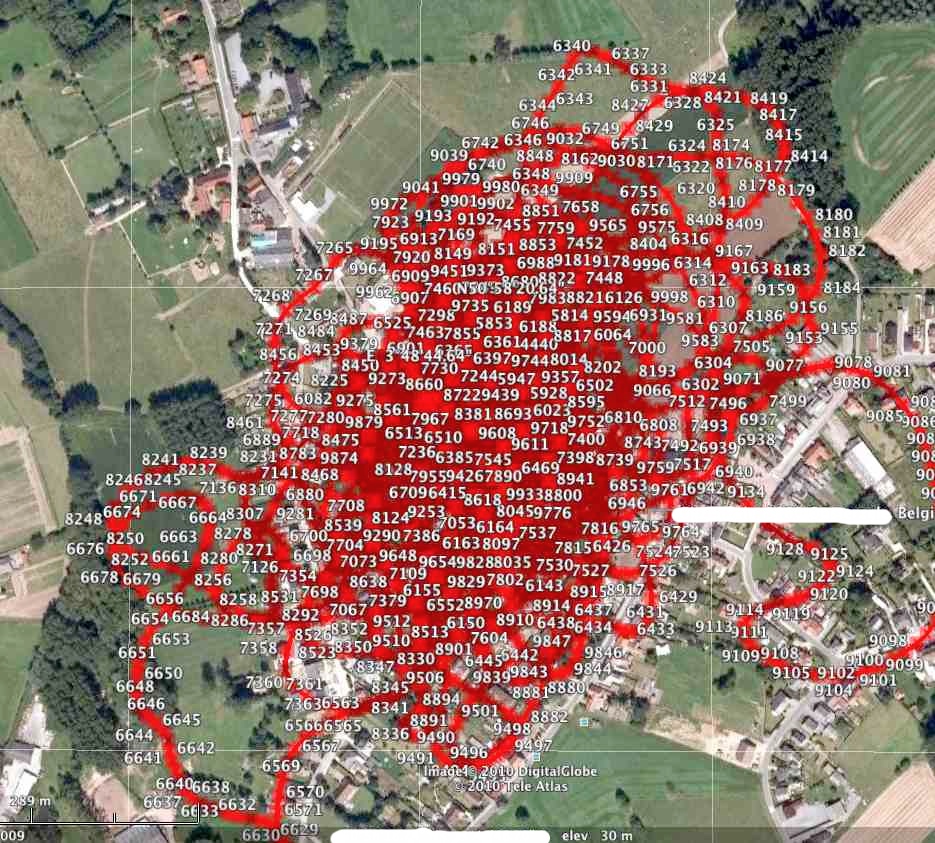
The output of the TechnoSmArt software is illustrated in photo 3.
Attaching the device to the pigeon
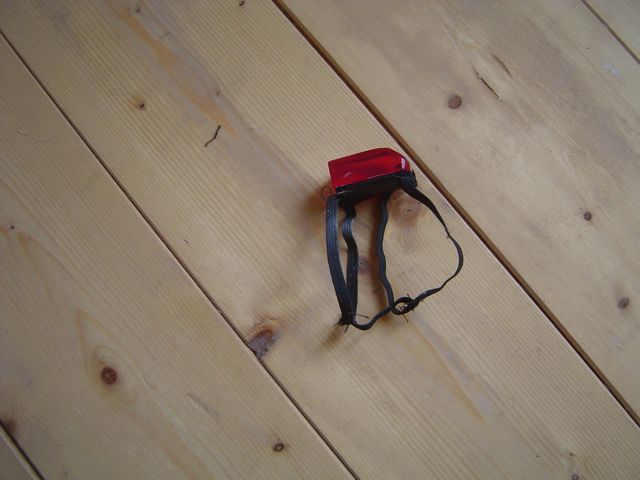
foto 5: Harness as provided by PigeonTrack
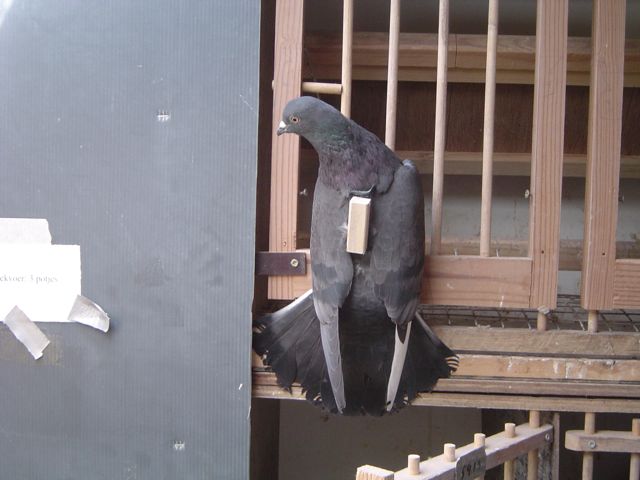
Foto 6: Pigeon with dummy device mounted on a harness
Based on the notes of the suppliers, there are two methods to mount the device on the back of the pigeon. The gps-logger of Pigeontrack comes with a harness as illustrated in ( foto 5). The harness has a velcro which is attached to a flexible strip. It is fixed on the body like a rucksack, holding the velcro slip securily on the back of the pigeon. In the loft the pigeon carries a dummy device with the same dimensions and weight as the real thing. After a week, the pigeon can be released with the real gps-logger. I tested this method with some tipplers. The pigeons seemed very comfortable with the harness and never give it any attention. But in the air, the bird abandoned the flock after some hours indicating that this was not an ideal situation. This happened several times.
The second method ( photo 6)is described by TechnoSmArt and is more complicated. On the back of the bird, over an area of 3 cm by 5 cm the feathers are cut to 1 cm of their base. They are cut in a way that the skin remains covered by the feathers; a velcro strip with the same dimensions is then glued to the feathers using a leather glue. Cutting the feathers short gives a good stable support for the velcro. Needless to say that this support has to be checked each time the device is attached but I never had any problems with it; when moulting the feathers regrow. TechnoSmArt advises not to use glue based on cyano-acrylate.
Analysis of the data
It is not easy to analyze the data which come in the original format (*.nme of *.nmea). Some knowledge on the storage of gps-data is welcome.
GPS time recordings come in UTC-time (Coordinated Uiversal Time); This time needs to be converted to the local time, taking into account summer-and winter-time.
Height is indicated in meters (TechnoSmArt), but a correction is needed. Height measurements are done in relation to a "geoid" which represent the hypothetical sea-level. According Google Earth my loft is 30 m above sea-level. However the device reports 70 m. I don't know how this exactly works, but I simply take this 70 m recording as zero height.
A GPS-fix is expressed in radials (longitude and latitude). The distance between two gps-fixes is done with the "Haversine formula". By making the sum of all these distances we have the total distance traveled. In addition to this, the distance of each fix is calculated with regard to the loft.
GPS and Tipplers
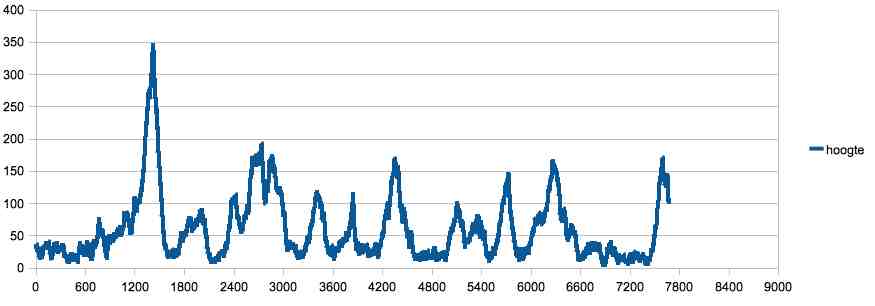
The altitude of this flight regularly shows some peaks towards 200 m. Most kilometers are done below 100 m. Of course this also depends on the breed and climate conditions. A typical elevation change is illustrated in figure 1; It is remarkable that there is a certain regularity in it.
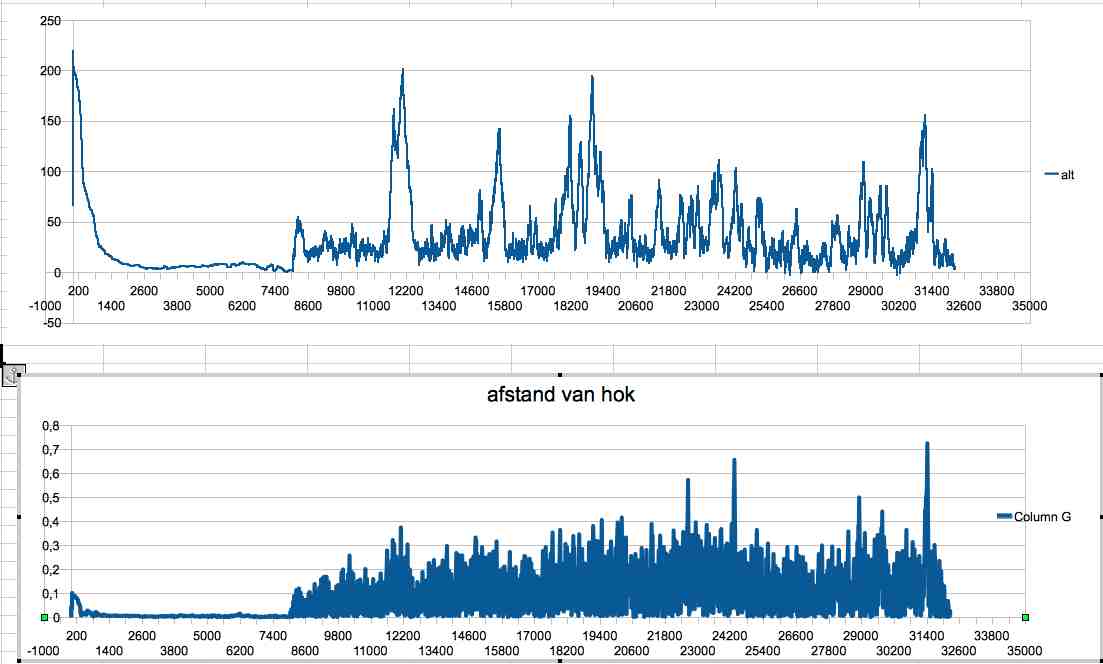
The flight of April 28 shows some interesting data. Released at 7:00, the first two hours are done on low height, always close to the loft. Then the trajectory becomes more erratic: the height pattern changes and the circles get bigger, with a maximum distance of 700 m from the loft. It is striking that the height differences coincide with a larger circle (the distance from the loft increases), as if they suddenly become much more active. The flight ends around 4 pm. During this 9-hour flight, they traveled 290 km!
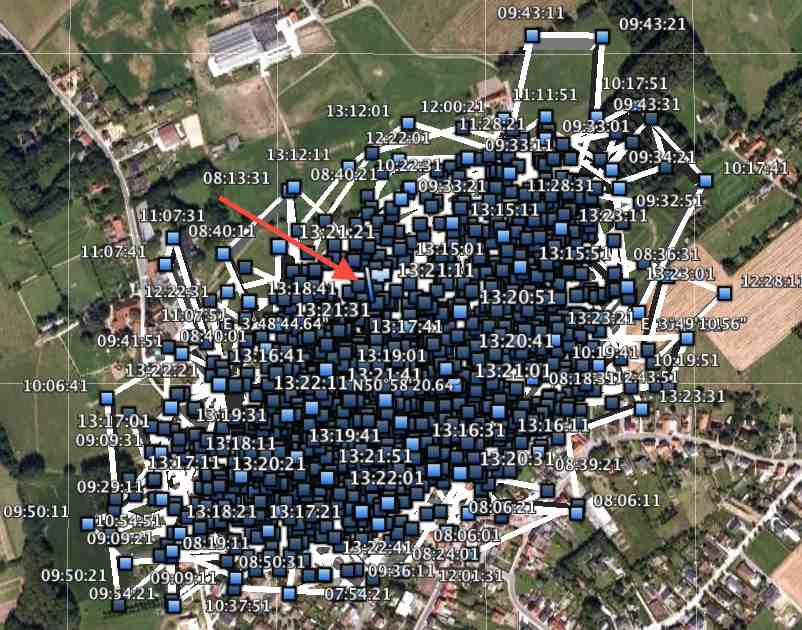
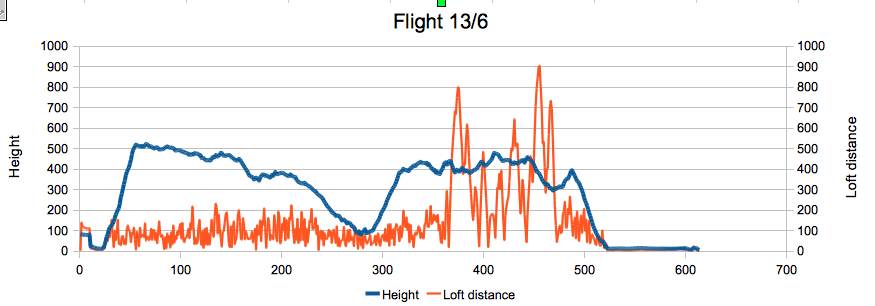
Figure 3 shows the course of a flight on June 7; the flight lasted 10:26 with a total of 249 km. You can label this as a typical tippler flight with a regular yo-yo movement in terms of height. The maximum distance from the loft was up to 600 m. In Google Earth ( photo 7 ) you see an angular course of the flight because the measuring points were recorded with an interval of 10 seconds. The red arrow indicates the location of the loft (flag).
GPS en Budapester Highflyers
At the beginning of 2010 I only had one cock that was not breeding; so all measurements were done with this specimen, which I personally do not consider to be the best in my loft (after all, the others were breeding). It concerns a late youngster from 2009 that was always accompanied by young pigeons during the measurements in 2010. The experiment with the budapester ended at the beginning of June because he, along with several others, was lost during a very high flight and never returned. never heard of it, although he had a name ring with a mobile number.
GPS-data: Overview 2010
| Date | Interval (sec) | duration | total distance (km) | max. speed (km/u) | average speed | highest point (m) | max. distance from loft (m) | number of measurements |
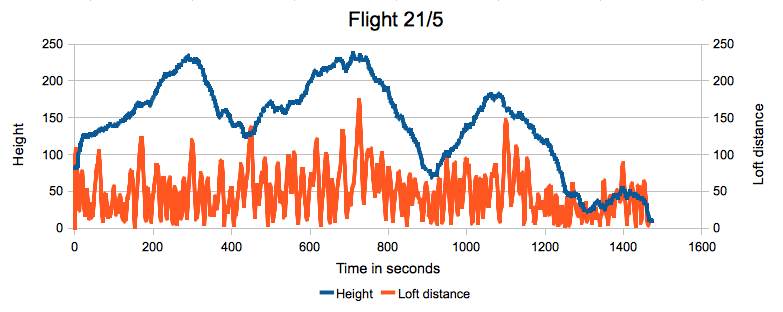
| 21/5 | 1 | 00:44 | 17.15 | 62.26 | 23.39 | 236 | 170 | 2630 |
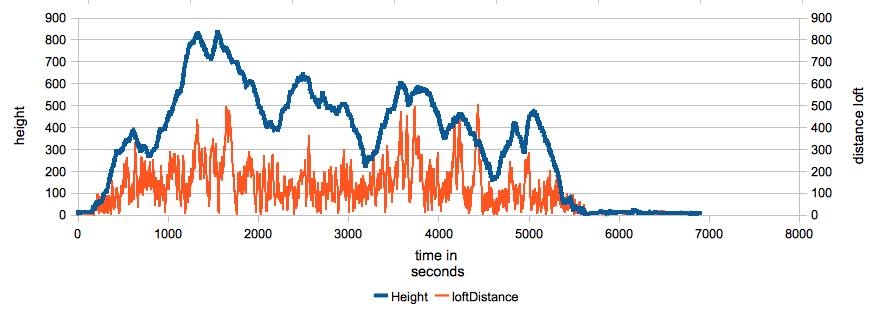
| 22/5 | 1 | 01:52 | 73.2 | 80.43 | 39.21 | 833 | 500 | 6770 |
| 23/5 | 1 | 02:15 | 91.3 | 72.47 | 40.58 | 583 | 1220 | 8122 |
| 24/5 | 1 | 01:34 | 45.22 | 75.82 | 28.87 | 329 | 330 | 5691 |
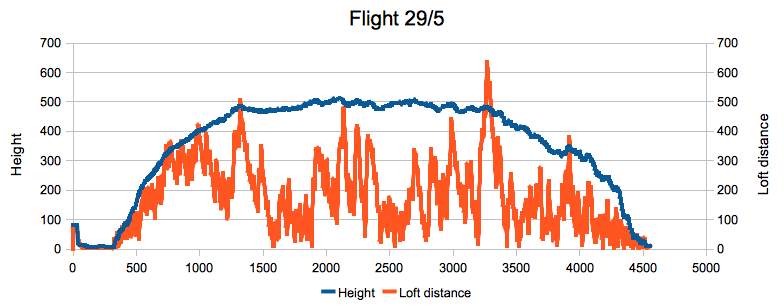
| 29/5 | 1 | 01:41 | 45:93 | 82.84 | 27.29 | 512 | 630 | 6069 |
| 3/6 | 15 | 00:36 | 9.19 | 71.23 | 15.32 | 204 | 310 | 602 |
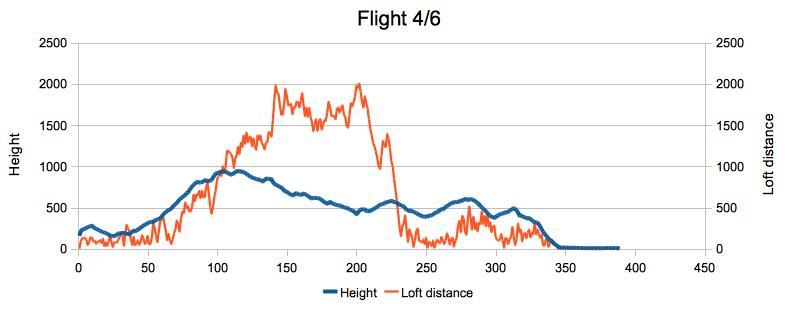
| 4/6 | 10 | 01:04 | 41.62 | 96 | 38.78 | 941.5 | 2000 | 389 |
| 5/6 | 10 | 00:26 | 7.43 | 59.24 | 17.15 | 279.49 | 210 | 159 |
| 13/6 | 10 | 01:42 | 51.62 | 81.08 | 30.36 | 520 | 900 | 614 |
| 22/6 | 10 | 00:31 | 8.71 | 71.97 | 16.87 | 236 | 290 | 192 |
| 23/6 | 10 | 02:00 | 30.31 | 59.76 | 15.16 | 424 | 590 | 726 |
The table above gives a list of all measurements made in 2010. The figures are slightly less correct than the tippler measurements because I am less disciplined with budapesters. After the flight they often sit on the roof instead of going directly into the loft and that falsifies the averages. So there is some noise but I tried to filter out those stationary phases with a self-developed software program. In summary, I can say that the performance is below par compared to the quality of the pigeons. Provided adapted training and nutrition, there is certainly much more to get out of it but during this time of the season, tippler training takes precedence. Just an explanation about the measured values:
- Interval: number of seconds between each measerement; one second is too much; 5 to 10 seconds is ideal
- Duration: format hours:minutes; duration of the flight from the beginning until they land
- Total distance covered during the flight; less errors with small interval measurements
- Maximum speed measured during the flight
- Average speed: shows some variation due to resting on the loft after landing, although I tried to filter these out.
- Highest point: important for highflyers! the highest point was 940 m which I consider as important.
- Maximum distance from the loft: distance in a straight line to the loft; often distance and height are correlated; the furthest point is about 2 km, which is higher as compared to tipplers; so Budapester pigeons should have more navigation skils to return to the loft.
GPS data: details
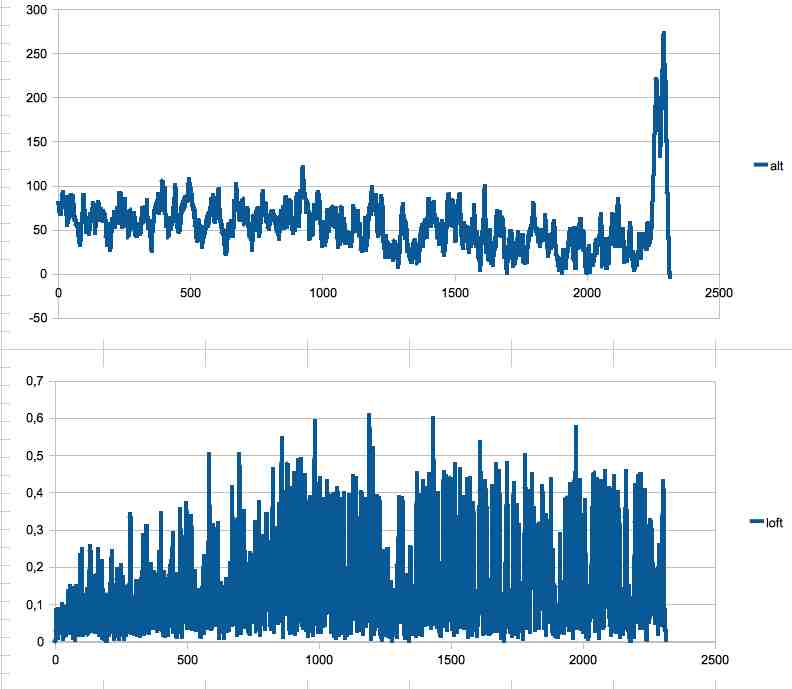
Let's get into the details of some flights. The blue line shows the course of the height (left Y-axis). The distance from the loft is illustrated by the red line (Y-axis on the right). When the red line is at 0, this means that the pigeon is in the vicinity of the loft.
Flight simulations
Numbers and charts don't say everything. They give an idea about the dynamics of the flight but not about the course of the route. Below are two videos showing the course of the trajectory in Google Earth. The flight starts at the loft. The square marks are the measuring points (every second at the first flight, every ten seconds on the second). The measuring points are connected by a vertical line to the ground to give a better insight into the position of the measuring point.
Below the flight of May 22 with a maximum height of 833 m and a maximum distance to the loft of 500 m. The measuring points were recorded with an interval of 1 second; this results in a very smooth movement of flight simulation.
The second flight was registered on June 4 and had a maximum altitude of 941 m; distance from the loft was up to 2 km which in my opinion is very far for this kind of pigeon. The measuring points were taken every 10 seconds and this results in a less distinct trajectory simulation.